現在取り組まれている研究について教えてください。Could you please tell us about your current research work?
身の回りの情報をコンピュータ上で効果的に表示する「情報可視化」という研究に注力しています。企業での13年間の勤務の間に、情報可視化以外にも多数の研究分野に従事していましたが、情報可視化のテーマで最もメジャーな論文を出すという研究成果を残しました。また、本学赴任後は、情報可視化が研究分野の中で最も多くの学生の注目を集めたことから、現在でも情報可視化を中心に研究を進めています。
My current research is focused on “information visualization,” in which information on the things around us can be effectively displayed on a computer. Although I was engaged in many research fields other than information visualization during my 13 years of company employment, I published my most important research paper in the field of information visualization. Moreover, since being appointed to my role at the University, information visualization has attracted the attention of most students among my research areas, so I am focusing on this field.
「情報可視化」とは具体的にどのようなものですか?
What is “information visualization”?
情報可視化とは、表計算ソフトなどに搭載されているグラフ表示機能を高性能化したような技術であるとも考えられます。身の回りの大規模で複雑なデータの全貌を表示して概要を理解し、その中に潜む興味深い現象を発見するために利用します。人間が自らデータを理解して意思決定につなげるための有用な道具であるともいえます。
Information visualization can be considered as a sophisticated version of the graphing technology provided on spreadsheet software. It is used to represent an overall view of the large and complex data of our surrounding and understand an overview of that data, as well as discover the interesting phenomena hidden within it. It is a useful tool that enables users to understand complex data in a simple manner and make decisions.
膨大なデータの全容を見ながら、それらのデータの奥深くにある新たな現象を見つけていくイメージでしょうか?具体的にどのような事例がありますか?
Is the idea of viewing the entirety of a large amount of data and discovering the new phenomena lie deep within this data? Can you give any specific examples?
具体的な事例として、クレジットカードの不正使用履歴、ソーシャルネットワークの人間関係、公共スペースでの人流、原子力システムの故障診断、創薬のための化合物探索の過程、音楽の構造や分布、その他にも多種多様な学術分野でのデータ分析の手段として研究を進めています。企業とも多くの共同研究を進めており、また情報可視化の教科書*1も出版しています。
Examples of these complex-data representation would include the history of credit card fraud, human relationships within social networks, the flow of people in public spaces, failure diagnosis in nuclear systems, compound exploration for drug discovery, the structure and distribution of music. Furthermore, data analyses are being conducted in various academic fields. We are proceeding with a large volume of joint research projects with companies and publishing a textbook*1 about information visualization.
どの事例もわたしたちの生活と身近なものですが、情報可視化が幅広い領域と関連していることが分かりました。ぜひ、伊藤先生の出版された情報可視化の教科書*1を読みたいです。
These examples are familiar to us in our daily lives, and we understand that information visualization is related to a wide range of areas. I would certainly love to read the textbook*1 on information visualization that you have published, Professor Itoh.
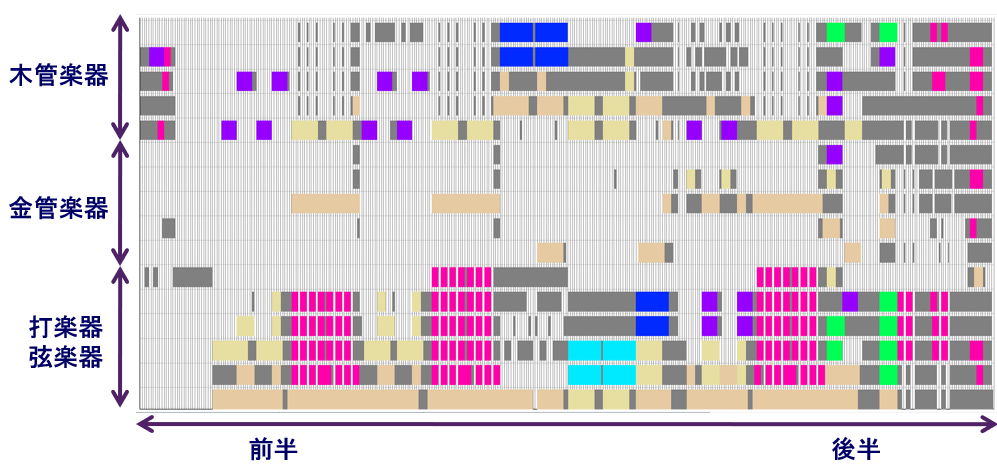
音楽の構造を示した図Figure of music structures
ジェンダード・イノベーションの視点と先生のご専門との関係性を教えてください。According to you, what is the relation between your perspective on Gendered Innovations and your research area?
2015年頃からの第3次AIブーム*2の中で、AIの代表的技術である機械学習の動作結果の適切さを検証する必要性が議論されるようになりました。その一環として、機械学習に入力する訓練データの適切さ、あるいは機械学習の出力結果の適切さを情報可視化によって検証したいという相談がいくつか寄せられるようになり、主要な研究課題の一つになりました。
Since the 3rd artificial intelligence (AI) boom around 2015*2, the appropriateness of the processing results of machine learning, a leading AI technology, are being actively discussed. As part of this discussion, people have told us that they want to verify the appropriateness of the training data used for machine learning as well as the results of machine learning output using information visualization. This has become one of my main research topics.
さまざまなところから持ち込まれた相談が、現在の研究につながっていったのですね。
So, the experience in consultations brought to you from various sources led to your current research.
その中でも興味深かった課題に、「AIによる映画推薦結果の可視化」という課題がありました。過去の鑑賞履歴にもとづいて各々の顧客に映画を推薦するAIを共同研究者が構築したのですが、鑑賞履歴データに男性のほうが多かったために、男性顧客に適切な推薦結果が多くみられ、女性顧客には偏った推薦結果が多くみられるのが観察されました。このことからデータの偏りを可視化することの重要性を認識しました。
Among these, a particularly interesting issue was “the visualization of movie recommendation results using AI.” The joint researchers have constructed AI for recommending movies to individual customers based on their viewing history. However, the majority of viewing history data was from men; therefore, although male clients were likely to receive appropriate recommendations, female clients had a tendency to receive biased recommendations. From this observation, we realized the importance of visualizing gender bias in the data.
ベースとなる鑑賞履歴データに性別の偏りがあれば、AIによる推薦結果にも偏りが生じるということですね。たしかに、データの偏りが可視化されることで、これまで見えていなかった多様な問題の発見にもつながりそうです。
So, you are saying that if there is a gender bias in the data that forms the basis of the recommendation, then the AI recommendation results will also tend to be biased, right? Certainly, by visualizing the bias in the data, we can discover various other problems that we could not see before.
はい、ジェンダード・イノベーションが性別に起因する不利益の解消を目的としているとしたら、その不利益をデータから発見することが研究の第一歩であり、その発見にはデータの偏りの発見が大きな課題となります。
第3回IGIセミナーで講演した「ジェンダーバイアス発見のための情報可視化」では、男女間のデータの偏りに注目した可視化結果を紹介いたしました。
That’s correct. If the goal of gendered innovation is to eliminate gender-based disadvantage, then surely the first step in research is to discover the disadvantages via information visualization. Therefore, finding bias in the data is a major challenge for discovering such disadvantages.
In “Information Visualization for Discovering Gender Bias,” which was presented at the 3rd IGI seminar, I have reported the results of visualization, focusing on bias in data between the sexes.
第3回IGIセミナーでは、データから男女の寒暖の感じ方の違いを見る面白さ、自殺者数のデータの切り取り方によって解釈が異なる危険性など、さまざまなデータ可視化の事例をご紹介くださりありがとうござました。データが持つバイアスの留意点なども分かりやすく、参加者の皆さまからもたくさんの反響がありました。
Thank you very much for introducing such a wide variety of examples on data visualization at the 3rd IGI seminar. I was interesting to see examples of data visualization, such as the difference in how men and women perceive cold and warm weather, and how the number of suicides can be interpreted differently depending on how it is treatment. The remaining issues concerning bias in the data were also easy to understand and many positive feedbacks were received from participants.
The report presented at the 3rd IGI seminar can be found here(in Japanese).
第3回IGIセミナーの様子The 3rd IGI Seminar
研究に取り組むことの面白さはどこにありますか?What do you find interesting about this research?
可視化の研究はいろんな視点からの考察が必要です。どのような計算をすれば適切な表示ができるかという数理的な面もあれば、どのようなデザインを採用すれば正確にデータを読まれるかという認知的な面もあり、さらにユーザが使いこなせるソフトウェアとして開発するための工学的な面もあります。このような幅広い視点からの課題が可視化という研究分野の魅力の一つです。
The study of visualization demands the consideration of things from a wide range of perspectives. There is the mathematical aspect of how to perform relevant calculations such that the results are displayed appropriately. Furthermore, there is the cognitive aspect that considers the kind of design to be used such that the data read accurately. Moreover, there is an engineering aspect of developing software that can be employed by the user. I think that visualizing issues from such a wide range of perspectives is one of the attractions of this research field.
「情報の可視化」というテーマで、自身の興味のある領域からアプローチができることだけでなく、異なった領域のメンバーと一緒に研究に取り組むことができることは、学生さんにとっても魅力的だと思います。
I think it is attractive not only for students to work on “information visualization” from their own fields of interest, but also to be able to discuss their research with members from other fields.
さらに、可視化の研究は非常に幅広い分野や産業の方々との協業が可能です。科学技術を対象とすることもあれば、社会現象や人間行動を対象とすることもありますし、文化や芸術を対象とすることもあります。個々の学生の趣味や興味をそのまま研究にすることも容易なので、毎年のように新しい研究テーマが生まれます。
わたし自身も音楽制作を長く趣味としてきましたので、音楽の可視化という独自の研究課題に長年取り組んでいます。このような適用範囲の幅広さゆえに、雑学博士のような研究室をつくれることがわたしにとって大きな魅力となっています。
Additionally, the study on visualization enables joint research in an extremely wide range of academic fields and industries. At times, it may focus on science and technology, while other times the focus is on social phenomena and human behavior as well as the culture and arts. New research premise is being created every year as it is simple for students to transform their hobbies and interests into research. Music has been my hobby for a long time.
Therefore, I have been working on my very own research project on the visualization of music for many years. What intrigues me is that, with the wide scope of applications available, I can create a laboratory like that of a doctor of miscellaneous sciences.
「雑学博士のような研究室」。音楽というご趣味も可視化してみようと、楽しみながら取り組まれる伊藤先生の研究姿勢をうかがって、私までわくわくしてきました。
Laboratory like Dr. Miscellaneous Science! When I heard about Professor Itoh’s approach to research, and your enjoyment while visualizing his hobby of music, it made me excited as well.
可視化に限らず情報科学全般に言えることですが、国際協業が非常に活発な分野でもあります。わたしは、国際的な仕事にあこがれて外資系企業の研究部門に就職したのですが、その願望は大学教員になっても実現の幅が広がり続けていて、その意味でも楽しい日々を過ごしています。
It does not end with visualization, however, and informatics science in general is a field with lively international collaboration. I was interested in pursuing an international-oriented job, so I found a job in the research department of a foreign-affiliated company. The desire to expand this realization continued even after I became a university faculty member, and in that sense, I am enjoying my days.
グローバルな仕事というと、語学を使う仕事、外資系や海外の会社で働くことを第一に思い浮かべますが、大学教員という道からもその夢を叶えられるということですね。
When I think of a global job, the first thing that comes to mind is a job that uses language skills and working in a foreign-affiliated or overseas company, but it is possible to achieve that dream as a university faculty member as well.
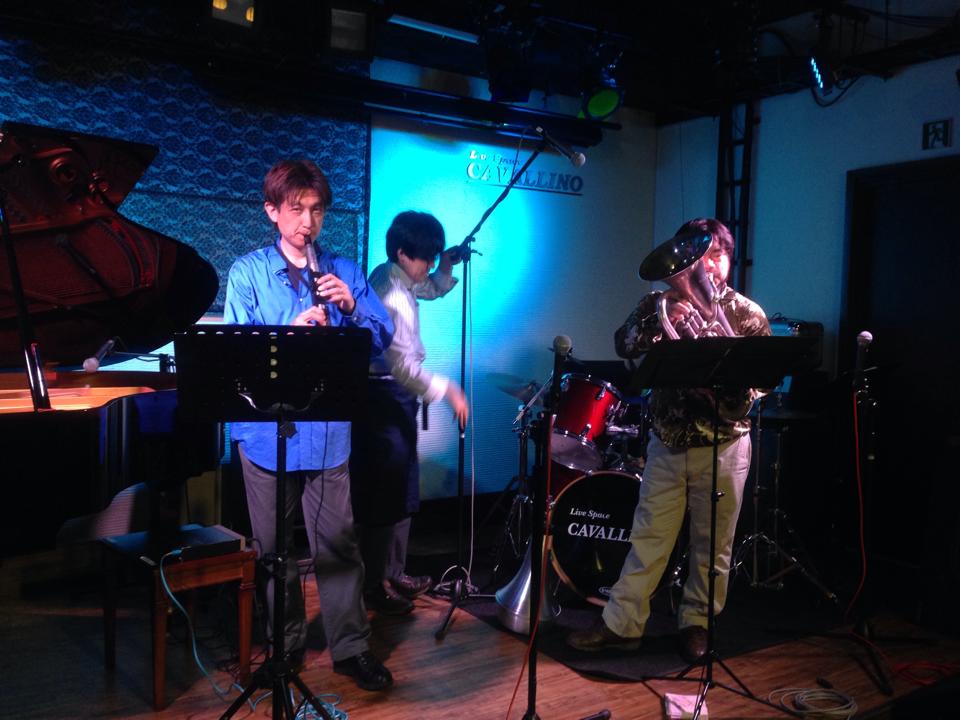
ライブハウス出演時の伊藤先生Professor Itoh performing live music
先生は企業で研究員として働いたご経験がありますが、どうして大学に転職したのですか?You have experience working as a researcher in a company, so why did you take a job in a university?
企業から本学に転職した理由は主に3つありました。1つ目は、東京都心に勤務したかったこと。2つ目は、企業人時代から大学で授業や講演を担当する機会があって学生と接する仕事に魅力を感じたこと。3つ目は、可視化をはじめとする自分の専門分野の研究から勤務先企業が撤退したことです。
There were three reasons why I switched my job from working in a company to working in a university. The first reason was that I wanted to work in the heart of Tokyo. I had the opportunity to teach classes and deliver lectures at universities in my days as a corporate employee, and I was attracted to the idea of interacting with students. So, this is my second reason for switching the job. The third reason was that the company I was working for had withdrawn their focus from the field of visualization and other fields of my interest.
企業では、専門分野の研究ができなくなるということがあるのですか?
Is it the case that you would not have been able to conduct research in your particular field of expertise if you were working in a company?
企業での研究は社会への貢献を直接感じる機会に恵まれており、やりがいを感じる機会がとても多いように思います。一方で、企業での研究は利益につながることも重要で、利益の可能性が低い研究分野からは途中で撤退することがよくあります。また企業では人事異動がつきもので、自分が望む研究分野に就けるとは限りませんし、それどころか研究以外の部門への異動もつきものです。大学で任期のない職に就くことができればそれらの心配が少なくなるので、長期的な計画に立った研究に有利であると考えます。
Research in companies is often blessed in the sense that you feel like you are directly contributing to the society, and there are many opportunities that make you feel like you are doing something worthwhile. However, corporate researches are mostly connected to profit, so companies may withdraw from research fields with a low possibility of profit midway. Additionally, there will often be rotation of personnel in companies; so you may lose the opportunity to work in the research field of your choice or be transferred to a non-research department. If you can work in a non-tenured position at a university, the aforementioned concerns will be reduced, and it is an advantage for research based on a long-term plan.
企業と大学では、研究による貢献のあり方が異なっているということなのですね。どのような研究者になりたいかということと関係しそうです。もうひとつ、これから研究者を目指す学生さんが安心して研究に専念できるように、任期がない職に就くチャンスが増えるといいなと思います。
So, you are saying that the approaches of the research contribution differ between companies and universities. I think it is related to what kind of researcher you wish to be. I would also like to see more opportunities for students who aim to become researchers, who can take positions that with tenure, so that they can focus on their research with a peaceful mind.
わたしにとって企業に勤務した13年間はとてもエキサイティングな時間であり、転職時にはこの境遇を失うことへの不安もありました。しかしそれ以上に、大学にて授業や研究指導を通して学生と接する時間は自分には非常に有意義な時間であり、その点では大学に転職してよかったと思います。
For me, the 13 years that I spent working at the company were quite exciting, and I was anxious about losing this enthusiasm if I switched jobs. However, I felt that the time I spent interacting with students through classes at university and research supervision was extremely significant, and I think this was an advantage for me when changing jobs.
お話をうかがって、きっと企業でのエキサイティングなご経験を生かして、大学でも魅力ある授業や研究指導をくださっているのだろうと思いました。
I am persuaded that the inspiring experiences you gained in the business world are reflected in your fascinating teaching and the research guidance you provide at the university.
会社員時代の講演の様子Lecture at the time of the company researcher
最後にジェンダード・イノベーション研究に興味を持った方、これから取り組もうとしている方へのメッセージをお願いします。Final Question. Please give a message for those who are interested in Gendered Innovations research and want to get involved in this field?
不利益のない社会は、満足度の高い社会につながります。例えば女性の不利益の解消は女性だけでなく男性の満足度にもつながります。不利益のない社会の実現の第一歩として、データから不利益を発見することが重要であると考えます。この課題に興味をもつ方々との議論の機会を楽しみにしています。
A society without disadvantages can create a society with a high level of satisfaction. For example, the elimination of disadvantages for women improves the satisfaction of both men and women. I think that the first step toward realizing a society without disadvantages is to discover where the disadvantages are resulting from the data. I am looking forward to the opportunity for discussing this topic with interested students.
データを可視化することで、誰もが不利益を感じない公正な社会を実現しようといった前向きなメッセージをありがとうございました。伊藤先生のご研究に興味をお持ちの方は、ぜひIGIウェブサイトをご覧ください。
Thank you for your positive message about how visualizing data can help us realize a society for equity. Please check the IGI website, if you are interested in Professor Itoh’s research.
The introduction to Professor Itoh’s researches is click here.